In a world flooded with data, what matters most isn’t how much you have, but how you use it. For modern businesses, making sense of fragmented data across departments, platforms, and systems is a growing challenge. That’s where custom Business Intelligence (BI) dashboards come in.
At Arhpez Technologies, we build tailored BI dashboards that don’t just look good; they solve real business problems. From operational inefficiencies and performance blind spots to delayed decision-making and missed growth opportunities, we help companies move from reactive to proactive.
What Is a Custom BI Dashboard?
A custom BI dashboard is a visual interface that pulls and displays real-time data tailored to your business goals, processes, and decision-making needs. Unlike off-the-shelf dashboards that force you to adapt your workflow to the software, custom dashboards are built to fit your unique structure, integrating relevant KPIs, data sources, and visualizations.
Think of it as a control room for your business: a single screen that gives you the full picture and lets you act on it immediately.
Real Business Problems BI Dashboards Solve
1. Data Silos and Fragmented Reporting
One of the most common issues growing businesses face is data trapped in silos, spread across CRM systems, spreadsheets, ERP software, marketing platforms, and more. This fragmentation makes it difficult to get a unified view of performance.
How we solve it:
Our custom dashboards integrate data from multiple sources, cloud apps, internal systems, databases, and APIs into one centralized view. This unified approach enables better collaboration, accurate reporting, and faster decision-making.
2. Lack of Real-Time Visibility
Traditional reporting processes are often delayed, meaning decision-makers are looking at outdated metrics. By the time a report lands on your desk, the situation on the ground may have already changed.
How we solve it:
With real-time data syncing and dynamic visualizations, our dashboards help you monitor operations, sales, marketing, finance, and customer data as it happens. You don’t just get the “what”, you get the “what now.”
3. Inefficient Performance Tracking
Generic dashboards often track vanity metrics that look good on paper but don’t reflect actual performance or business health.
How we solve it:
We work closely with your team to identify the metrics that really matter, those that impact growth, revenue, retention, and productivity. Whether you need to monitor CAC/LTV, churn rate, sales velocity, or supply chain efficiency, our dashboards are designed for impact, not noise.
4. Overwhelming Data Interpretation
Raw numbers are difficult to understand and even harder to act on, especially for non-technical stakeholders.
How we solve it:
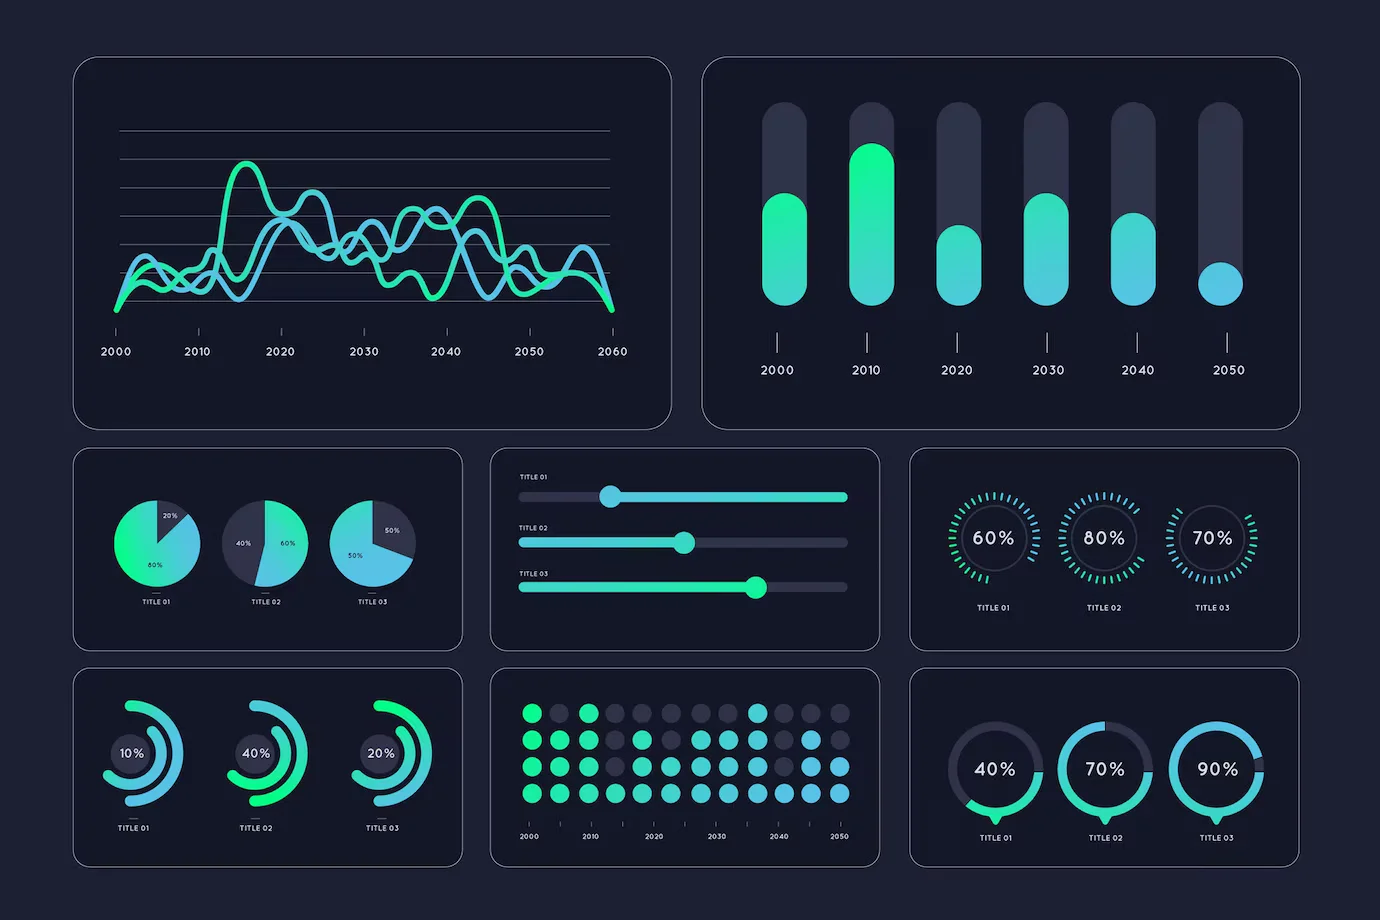
Our BI dashboards use clear visualizations, charts, graphs, gauges, and tables to tell a story. You don’t need a data science degree to understand what’s happening in your business. Our goal is to make data accessible and useful for every stakeholder, from C-suite to operations.
Industries We’ve Helped with BI Dashboards
From startups to enterprises, we’ve built custom dashboards for businesses across:
- Retail & E-commerce: Track inventory, optimize supply chain, and understand buyer behavior.
- SaaS & Tech: Monitor product engagement, MRR/ARR, churn, and usage analytics.
- Healthcare: Visualize patient outcomes, operational efficiency, and compliance metrics.
- Finance & Insurance: Real-time revenue, forecasting, and risk assessment.
- Manufacturing: Equipment monitoring, production KPIs, and quality control analytics.
Why Custom Over Off-the-Shelf?
| Feature | Off-the-Shelf BI | Custom BI by Arhpez |
| Setup Time | Fast | Tailored, but strategic |
| Flexibility | Limited | Fully customizable |
| Integration | Often partial | End-to-end systems integration |
| User Experience | Generic | Built for your users |
Our dashboards are not templates; they’re tools designed to match your workflows and growth trajectory. You’re not stuck with “standard” metrics; you get meaningful insights that match your goals.
Our Approach to Building BI Dashboards
At Arhpez Technologies, we don’t just plug in numbers; we partner with your business to design solutions that work.
- Discovery & Alignment
We begin by understanding your business model, goals, teams, and current data architecture. - Data Mapping & Integration
We identify your key data sources, internal and third-party, and build seamless pipelines to feed your dashboard. - KPI Planning
Together, we define what success looks like for your business, translating it into metrics and visual formats that provide clarity. - Design & Development
Our team builds intuitive, responsive dashboards optimized for desktop and mobile. Whether your stakeholders are analysts or executives, everyone gets what they need. - Testing & Optimization
We validate all metrics, test visualizations for clarity, and ensure that data loads fast and displays accurately. - Ongoing Support
Business needs evolve. We provide ongoing maintenance and upgrades to keep your dashboard relevant and effective.
Let’s Turn Your Data into Decisions
At Arhpez Technologies, we don’t just build dashboards; we help you solve problems, move faster, and make better decisions every day. If you’re tired of wasting time on outdated reports or guessing your next move, it’s time for a BI solution designed just for you.
Ready to build a smarter business with data that works for you? Contact us today for a free consultation on custom BI dashboards.
Frequently Asked Questions
How do custom BI dashboards differ from off-the-shelf BI tools?
Unlike off-the-shelf tools, custom BI dashboards are built around your workflows, KPIs, and existing systems. They integrate seamlessly with your data sources and present metrics that actually matter to your business goals, not generic templates.
What types of businesses benefit most from BI dashboards?
Any organization that relies on data for decision-making can benefit, especially industries like retail, e-commerce, SaaS, healthcare, finance, and manufacturing. We design dashboards that address each industry’s unique reporting needs and challenges.
How can BI dashboards improve decision-making?
Custom dashboards turn raw data into actionable insights. By tracking real-time performance and highlighting key trends, they enable teams to identify issues early, act quickly, and make informed decisions that support growth.
What data sources can Arhpez dashboards connect to?
Our BI dashboard development integrates with CRMs, ERPs, marketing platforms, cloud apps, APIs, and internal databases. This ensures every department operates from a unified source of truth.
How long does it take to build a custom BI dashboard?
Timelines vary depending on complexity and data integrations, but most dashboards are designed and deployed within 4–8 weeks. The process includes discovery, data mapping, design, testing, and optimization.
Do BI dashboards update data in real time?
Yes. We design real-time BI dashboards that automatically refresh data through live connections, ensuring every metric and visualization reflects your current business state.
How secure are Arhpez BI dashboards?
Security is built into every project. We use role-based access controls, encrypted data connections, and secure authentication protocols to protect sensitive business information.